Weaponizing Privileged File Writes with the USO Service - Part 1/2
The DiagHub DLL loading technique found by James Forshaw (a.k.a. @tiraniddo) has become very famous. Whenever you found an arbitrary file write as SYSTEM in Windows or in some third-party software, you could use this trick to get code execution on demand, and without rebooting. Unfortunately (or fortunately depending on your point of view), this method was mitigated by Microsoft in Windows 10 build 1903. Andrea Pierini (aka @decoder_it) mentionned this briefly on Twitter. Here, I want to share an alternative method I found while looking for DLL hijacking weaknesses on the most recent version of Windows.
Foreword
I want to begin this article by clarifying a few things.
- It is NOT a vulneratibilty. As we will see, in order to be able to use this trick, a specifcally crafted DLL must be planted into the
C:\Windows\System32\folder first, which only “privileged accounts” can do of course. - My objective here is to share some of the Research & Development work I do on my spare time, and thus show that you don’t need to be a super-elite all-star researcher to find cool stuff.
- If you are already experienced with Reverse Engineering on Windows, there is a high chance you won’t learn much from this. Otherwise, I hope you’ll get a few things out of it.
That being said, let’s dive right into the main subject.
Starting point
As a starting point, I decided to look for low hanging fruits, such as DLL hijacking in services running as NT AUTHORITY\System. The idea is to monitor services that can be started or at least “influenced” by a regular user. To do so, I made a very simple PowerShell script that checks whether a service has been started or stopped every second.
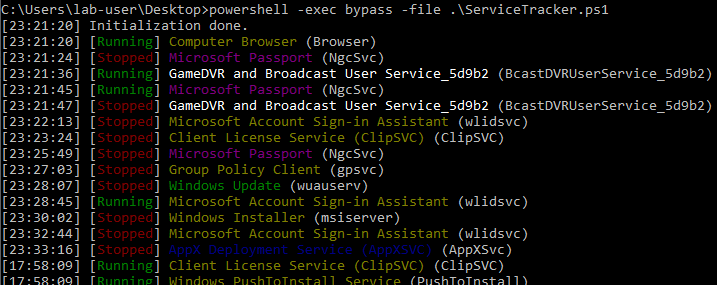
In the background, I always run Process Monitor to log filesystem operations. I simply configure the filter to only show operations involving *.dll files and returning a NAME NOT FOUND error code. Then, I tried to start every service I could without admin privileges one at a time. Unfortunately, I didn’t find anything with this method. What I did find though is the following.

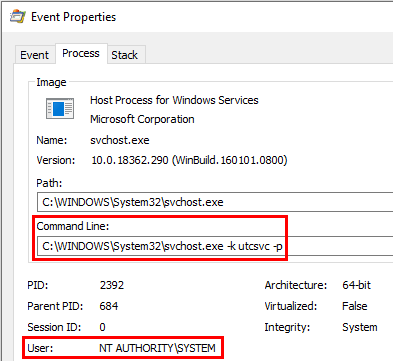
While Process Monitor was running in the background, it captured some attempts to open the file windowscoredeviceinfo.dll on a regular basis. The frequency varied, it could happen every hour or every 30 minutes for example. The properties of the event showed the Command Line of the process: C:\WINDOWS\System32\svchost.exe -k utcsvc -p.
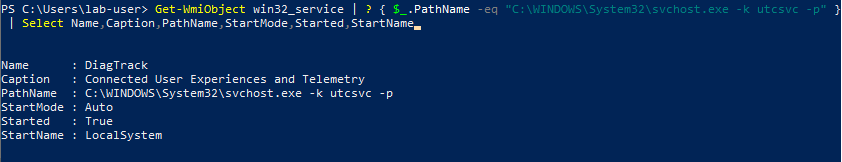
Knowing this, the corresponding service can easily be found with the following PowerShell command for example. In this case, it is DiagTrack.
Note: I could also have used the PID of the process and looked for it in the task manager for example. The downside of this method is that the process could terminate before you have the time to check.
Our first target: DiagTrack
The Event Properties in Process Monitor revealed a bit more about how the DLL was loaded. The Stack tab shows the list of calls that lead to this operation. Here, we can see that the initial call was made from diagtrack.dll. That’s where the DiagTrack service is implemented so this makes sense. The FlightSettings.dll file was loaded which, in turn, used the GetCensusRegistryLocation() method from dcntel.dll, and finally, windowscoredeviceinfo.dll was loaded using the standard LoadLibraryEx() WinApi call.

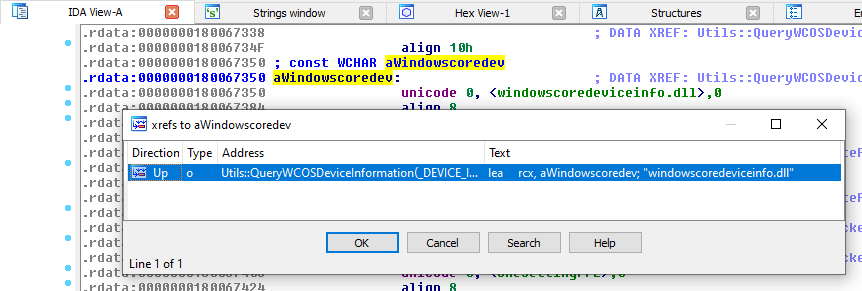
To be sure I was on the right track, I opened the last DLL in IDA and looked for occurences of windowscoredeviceinfo.dll. The Strings subview is really great for this kind of use case.
Note: you have to configure the view to include unicode strings because it’s not the default setting in IDA…
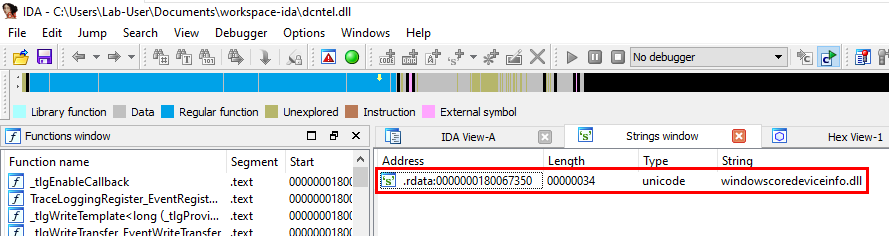
Then, we can go straight to its location in the .rdata section and look for Xrefs. In this case, there is only one. This string is indeed used in the QueryWCOSDeviceInformation() method. Well, the name looks promising at least!
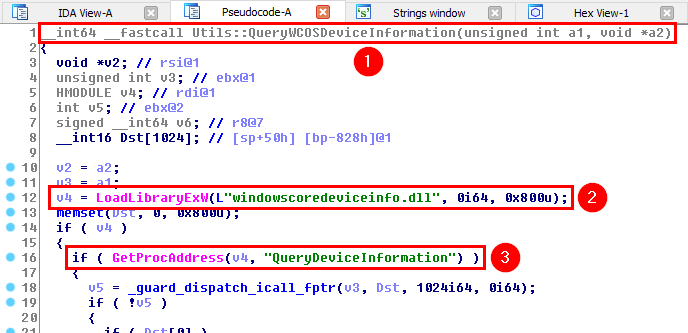
The pseudocode generated by IDA is pretty clear. We spot the LoadLibraryEx("windowscoredeviceinfo.dll") call we saw earlier with Process Monitor. Then, if the library is successfully loaded, the following call is made: GetProcAddress("QueryDeviceInformation"), which means that this function should be exported by windowscoredeviceinfo.dll.
Let’s sum up the situation. At this point, we know the following:
- An unkown task is run by the DiagTrack service on a regular basis (every 30 minutes or every hour).
- Each time, it tries to load a DLL called
windowscoredeviceinfo.dll, which doesn’t exist by default. - If it is successfully loaded, the
QueryDeviceInformationfunction is imported.
That’s a good start but I’m missing some key elements. For example, I have no clue how this “task” is run. I don’t even know whether I would be able to trigger it as a regular user. So, rather than starting to reverse enginneer the service without really knowing what I was looking for, I decided to create a PoC DLL and verify if I could really get arbitrary code execution as NT AUTHORITY\System.
Crafting a PoC DLL
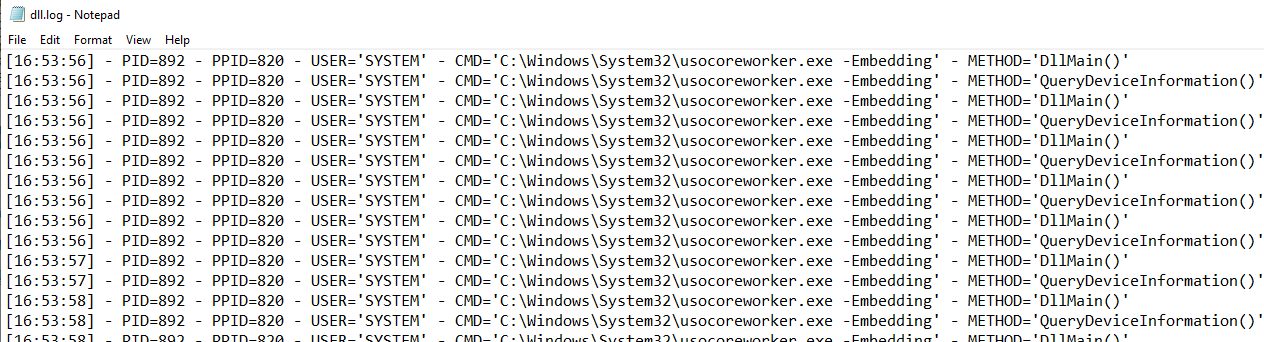
My objective for this PoC DLL was very simple. I wanted to log some key information about the process that loaded it: the command line, the current username, the PID, and the PPID. All of this would be logged to C:\temp\dll.log.
For a start, I came up with the following code. The TrackCall() function is responsible for gathering and logging the info. It is called from DllMain() and QueryDeviceInformation() to keep track of which function is called.
1
2
3
4
5
6
7
8
9
10
11
12
13
14
15
16
17
18
19
20
21
22
23
24
25
26
27
28
29
30
31
32
33
34
35
36
37
38
39
40
41
42
43
44
45
46
47
48
49
50
51
52
53
54
55
56
57
58
59
60
61
62
63
64
65
66
67
68
69
#include <Windows.h>
#include <iostream>
#include <Lmcons.h> // UNLEN + GetUserName
#include <tlhelp32.h> // CreateToolhelp32Snapshot()

int TrackCall(const wchar_t * callingFrom)
{
    WCHAR strSt[4096], strUsername[UNLEN + 1];
    WCHAR * strComandLine;
    SYSTEMTIME st;
    HANDLE hFile, hToolhelpSnapshot;
    PROCESSENTRY32 stProcessEntry;
    DWORD dwPcbBuffer = UNLEN, dwBytesWritten, dwProcessId, dwParentProcessId;
    BOOL bResult;

    strComandLine = GetCommandLine(); // Get Command line of the current process
    bResult = GetUserName(strUsername, &dwPcbBuffer); // Get current user name
    dwProcessId = GetCurrentProcessId(); // Get PID

    // Get PPID
    hToolhelpSnapshot = CreateToolhelp32Snapshot(TH32CS_SNAPPROCESS, 0);
    stProcessEntry = { 0 };
    stProcessEntry.dwSize = sizeof(PROCESSENTRY32);
    dwParentProcessId = 0;
    if (Process32First(hToolhelpSnapshot, &stProcessEntry)) {
        do {
            if (stProcessEntry.th32ProcessID == dwProcessId) {
                dwParentProcessId = stProcessEntry.th32ParentProcessID;
                break;
            }
        } while (Process32Next(hToolhelpSnapshot, &stProcessEntry));
    }
    CloseHandle(hToolhelpSnapshot);

    // Create log entry
    GetLocalTime(&st);
    wsprintfW(strSt, L"[%.2u:%.2u:%.2u] - PID=%d - PPID=%d - USER='%s' - CMD='%s' - METHOD='%s'\n", st.wHour, st.wMinute, st.wSecond, dwProcessId, dwParentProcessId, strUsername, strComandLine, callingFrom);

    // Save to log file
    hFile = CreateFile(L"C:\\Temp\\dll.log", FILE_APPEND_DATA, 0, NULL, OPEN_ALWAYS, FILE_ATTRIBUTE_NORMAL, NULL);
    if (hFile != INVALID_HANDLE_VALUE)
        bResult = WriteFile(hFile, strSt, lstrlenW(strSt)*sizeof(WCHAR), &dwBytesWritten, NULL);

    CloseHandle(hFile);

    return S_OK;
}

HRESULT __stdcall QueryDeviceInformation()
{
    TrackCall(L"QueryDeviceInformation()");

    return S_OK;
}

BOOL APIENTRY DllMain(HMODULE hModule, DWORD ul_reason_for_call, LPVOID lpReserved)
{
    switch (ul_reason_for_call)
    {
    case DLL_PROCESS_ATTACH:
        TrackCall(L"DllMain()");
        break;
    case DLL_THREAD_ATTACH:
    case DLL_THREAD_DETACH:
    case DLL_PROCESS_DETACH:
        break;
    }
    return TRUE;
}
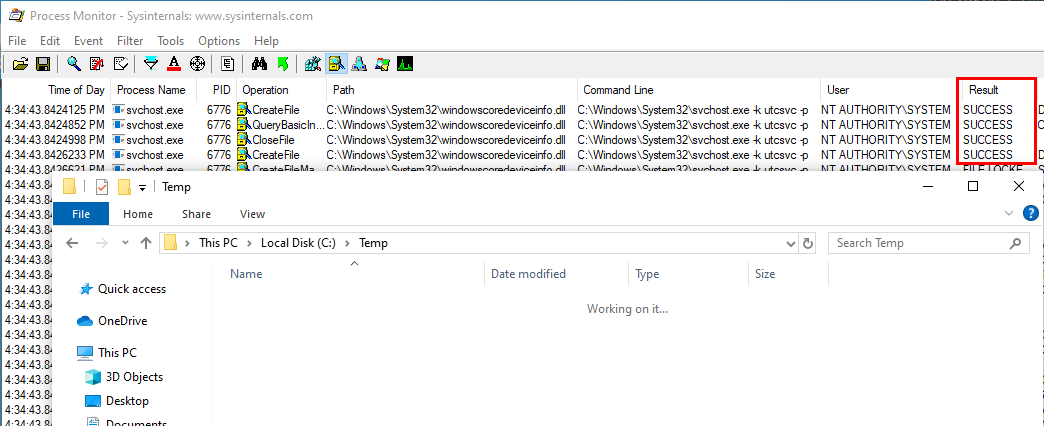
Then, as an administrator, I copied this DLL to C:\Windows\System32\ and, I waited…

After a moment, the first hits finally showed up in Process Monitor. All the CreateFile operations returned successfully. However, there was no sign of a log file being created in C:\temp\. Of course, this means that the DLL wasn’t properly loaded, the question is: why? My assumptation was that the DLL I created didn’t export all the functions that were required by the process.
At this point, I wasn’t sure how to proceed but, when I got back to Process Monitor, I saw some events that I hadn’t seen before.
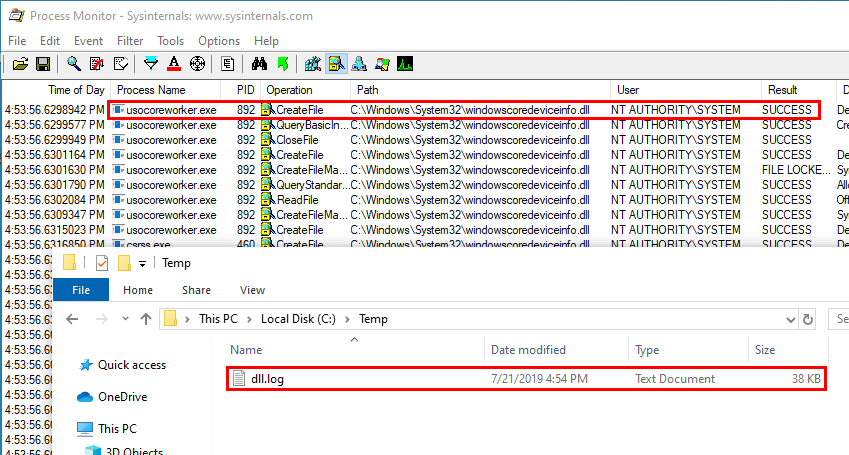
The file windowscoredeviceinfo.dll was also loaded by a process called usocoreworker.exe as NT AUTHORITY\System. This time, some information was logged to C:\Temp\dll.log, which means that the code was properly executed.
This looked much more promising so I decided to leave the DiagTrack service aside and take a look at this new target.
Moving on to the next target…
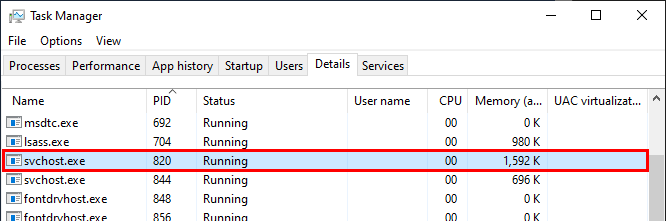
We are back to square one. We need to find out how the usocoreworker.exe process was created. To do so, we can look for the process corresponding to the PPID that was written to the log file. According to the task manager, it’s an instance of svchost.exe, just like most of Windows services, so it’s not very helpful.
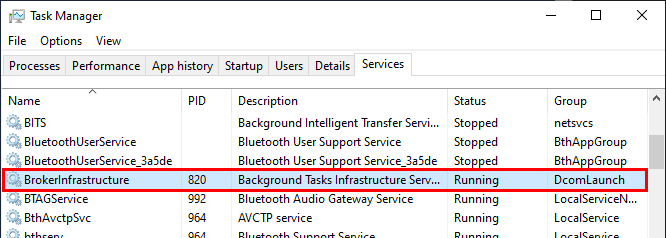
The corresponding service is BrokerInfrastructure, which “handles background tasks” as its description states. Well, that’s not really helpful either…
Let’s see what we can learn from Process Monitor. Accessing the properties of an event related to this process and, going to the Stack tab will show the following. We can see that there is a lot of references to rpcrt4.dll and combase.dll. This is potentially a very good news! Indeed, it probably means that this process was triggered by a COM-related RPC call. If so, it might also be possible to trigger it as a regular user, depending on the permissions of the remote object and interface.
Note: COM is used for Inter Process Communications (IPC). Therefore it can provide the ability for a low privilege process to run high privilege actions thanks to RPC calls (more details about this in the second part…).

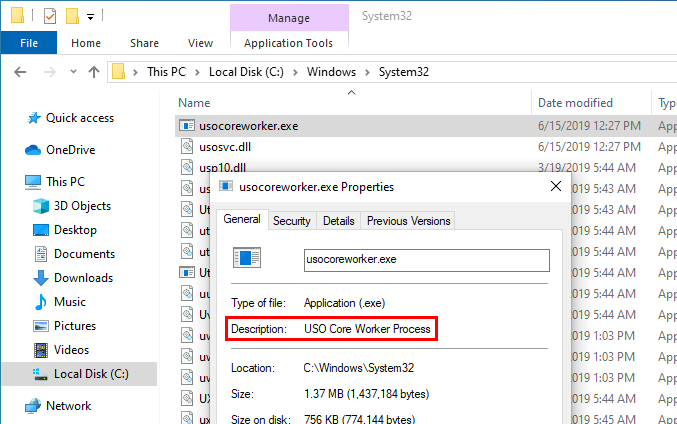
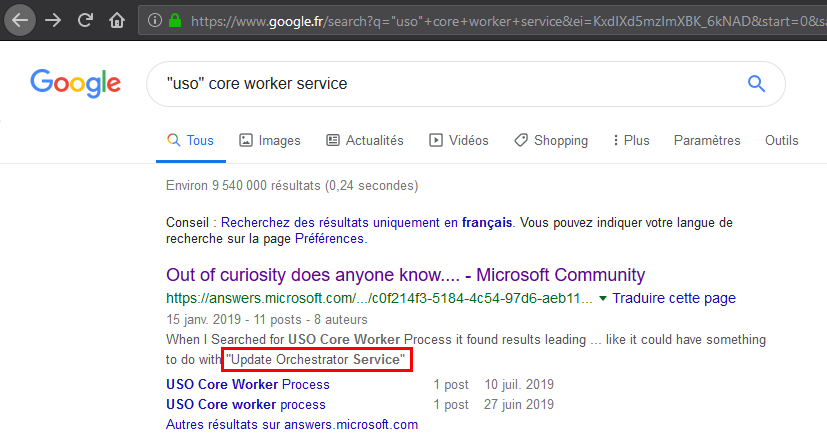
Looking at the properties of the binary file, we can see the following description: USO Core Worker Process.
Based on these first few elements, I tried to find more information on Google. The first result lead me to a thread on answsers.microsoft.com. According to one of the messages, this file is related to the “Update Orchestrator Service”.
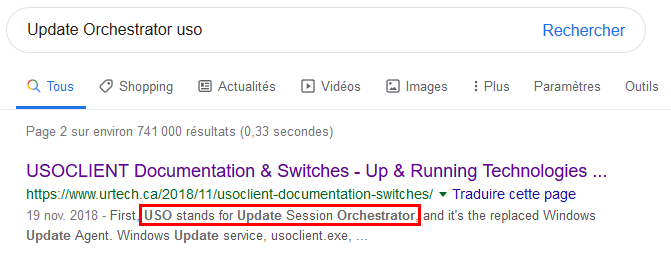
Refining the research, I found this very interesting unofficial documentation about the “USO client”. First, we learn that “USO” stands for “Update Session Orchestrator”.
We also learn that the “USO client” (usoclient.exe) is the tool that replaced “WUAUCLT”, which was used to manage Windows updates in previous versions of Windows. Actually, this tool is well known by Windows System Administrators because, although it is not officialy supported by Microsoft, it enables them to automate the update management process.

Note: they even quoted a reply from a Microsoft employee on TechNet, which says that you shouldn’t run this tool directly. This is getting interesting. We love to do what we are not supposed to, don’t we?! :)
The documentation lists all the options you can use. So, I tried to play around with the usoclient command to see if I could trigger the same behavior I observed previously. I started with StartScan which seemed to be the less invasive option according to the description. It is supposed to trigger a scan that will simply fetch available updates.
With Process Monitor running in the background as usual, I ran the command and… … victory!
Conclusion
With a simple command, we are able to have the Update Orchestrator service run arbitrary code as NT AUTHORITY\System. Another benefit of this method is the fact that we can run our code outside of DllMain (i.e. outside of the loader lock).
Note: According to Microsoft, running code within DllMain should be avoided because it can cause an application to deadlock. More info here: Dynamic-Link Library Best Practices.
However, this technique also comes with some drawbacks:
- It requires a privileged file creation or move operation that you’re are able to control.
- Vulnerabilities which result in ACL overwrites for example won’t be enough.
- As a regular user, we don’t know if the DLL has been successfully loaded or not.
Being dependant on the usoclient tool without understanding how it worked was also something I didn’t like about this technique. So, I reverse engineered both the client and the service in order to produce an open source tool I could reuse in future projects: UsoDllLoader. I’ll try to explain this process in the second part of this article. Stay tuned!
Links & Resources
- Windows Exploitation Tricks: Exploiting Arbitrary File Writes for Local Elevation of Privilege
https://googleprojectzero.blogspot.com/2018/04/windows-exploitation-tricks-exploiting.html - Twitter - MS finally fixed the “Diag Hub Collector” exploit on Win 10 1903
https://twitter.com/decoder_it/status/1131247394031579138 - Unofficial USO client documentation
https://www.urtech.ca/2018/11/usoclient-documentation-switches/ - Thread about the “USO client” tool on TechNet
https://social.technet.microsoft.com/Forums/en-US/7619f7fa-ffc1-433b-a885-12e26f9762bf/usoclientexe-usage?forum=win10itprogeneral - Dynamic-Link Library Best Practices
https://docs.microsoft.com/en-us/windows/win32/dlls/dynamic-link-library-best-practices